Solar Photovoltaic System at a Palestinian Village Ibrahim Yehia, Sol-Nur Enterprises The Ben-Gurion National Solar Energy Center The Jacob Blaustein Institute for Desert Research Ben-Gurion University of the Negev Sede Boqer Campus, 84990 Israel Greenstar Foundation contact: directors@greenstar.org Source of this document: http://www.greenstar.org/PVStudy/
EXECUTIVE SUMMARY Efficiency measurements were performed on the photovoltaic (PV) system at Al Kaabneh day school on July 18, 1999. Tests were made both at the component level and the system level. The principal components, i.e., the PV panels supplied by ASE Americas, were found to be of state-of-the-art efficiency and all were found to be operating in completely satisfactory manner. These are among the highest efficiency modules we have studied under desert conditions. Delivery of electrical energy from the roof-mounted PV panels to the indoor power conditioning components was found to occur with minimal, if any, loss. A number of recommendations are made that could help maximize system efficiency for all seasons of the year, including periods during which the school is not in session.
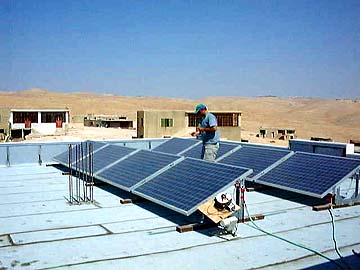
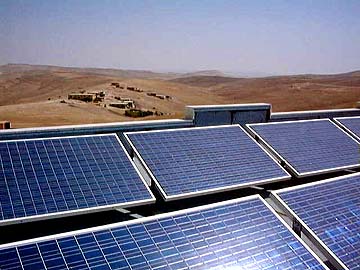
1. INTRODUCTION On July 18, 1999, we visited the village of Al Kaabneh, near Hebron, (approximate coordinates: Latitude 31 degrees 24 minutes N, Longitude 35 degreeso 12 minutes E) in order to perform a quantitative study of a 2.4 kWp PV system that Greenstar had installed on the roof of the regional high-school. The system consists of two strings of four ASE 300-DGF/17 modules, each string having its modules connected in series. The modules face due south at a tilt angle of 25 degrees to the horizontal. Two cables (one from each string) descend from the roof and feed an inverter / battery-storage system. Fig.1 shows the array as presently positioned on the roof-top of the school.
2. MEASURING EQUIPMENT For measurement purposes we took with us: 1. A Daystar Corp. I-V curve tracer. 2. A calibrated Eppley Corp. PSP pyranometer mounted on a stand having an adjustable tilt angle (shown in foreground of Fig.1). 3. A Solarex Corp. SX45 module (one of our standard references modules) for control purposes. 4. An ASE Americas Corp. ASE 50-AL/17 (of similar construction to the test modules) for additional control purposes. 5. Copper-constantan thermocouples with plugs (for attachment to the test modules). 6. A Campbell Scientific Corp. 21X micrologger (for recording irradiance and temperatures). 7. A hand-held wind gauge. 8. A laptop computer for downloading data from the I-V curve tracer and the micrologger.
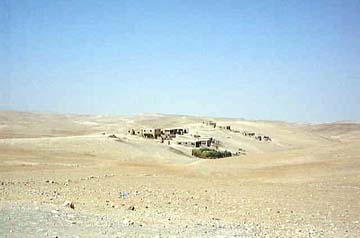
3. MEASUREMENT CONDITIONS Measurement conditions were as near perfect as could be desired since there was a cloudless blue sky from the time of our arrival at the site, around 10 am Summer Time [corresponding to 9 am Israel Standard Time (IST)], through the noontime, IST, period during which measurements were made. Wind speed was unmeasurably small. Fig.2 is a photograph of the village, taken as we were about to depart in the late afternoon. One sees that the sky was still cloudless at that time.
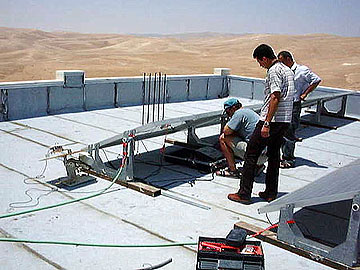
4. MEASUREMENT PRACTICE The test modules were disconnected from one another and thermocouples were attached to the rear surface of each, using adhesive tape. A reference module (SX45) was first set up parallel to the plane of the system array and the pyranometer stand was adjusted to the same orientation. An I-V curve was then taken for this reference module. The latter was then replaced by the second reference module (ASE 50) and another I-V curve was taken. The second reference module and the pyranometer were then re-orientated to normal incidence and a third I-V curve was taken. Finally, the second reference module was replaced by the first - this time also at normal incidence - and a fourth I-V curve was taken. The pyranometer was then re-adjusted to the angle of the system array and eight I-V curves were taken, one for each of the modules in the array. See Fig.3.
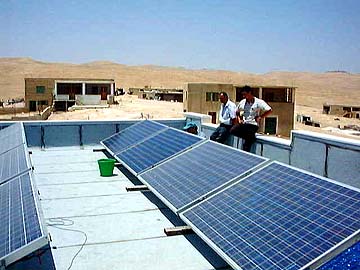
These twelve I-V curve measurements, together with their associated module temperatures and irradiance measurements, constituted the "first run", which lasted from 10:50 through 11:05 IST. The first run was then repeated two further times, the third run terminating at 11:38 IST - approximately solar noon. These first 36 I-V curves were then downloaded to the laptop computer, freeing the I-V curve tracer memory for some more-detailed studies. For the 3 runs described above, measurements were performed with uncleaned modules and (other than for the control modules) at non-normal incidence. The reason for this is that we wanted to have a set of measurements that represented one typical "as is" condition for the system. In actual fact, the modules were found to be lightly covered in dust with some flecks of paint/whitewash -- the latter, no doubt, being the product of nearby decorating work that was in progress during the time of our visit to the site. However, for more quantitative purposes, the following additional tests were performed. Two of the modules, "A" and "B" (see Table 1) were then cleaned (Fig.4) and re-measured. One of them, "A", was subsequently moved from its stand and measured under conditions of normal incidence.
Finally, the array modules were re-connected in their original configuration and the array I-V curves were measured downstairs, at the input to the inverters. For these measurements however, neither the module temperatures nor the solar irradiance were actually measured. Nevertheless, both could be estimated quite well by extrapolating the previous measurements of these parameters.
5. RESULTS OF CONTROL MEASUREMENTS 5.1 Control module SX45 Table 2 presents the results of all seven I-V curve measurements taken at Al Kaabneh on our SX45 control module. The table displays: in column 2, the observed range of "as is" measurements (including plane of aperture irradiance and module temperature); in column 3, the average of the measurements after adjustment, as closely as possible, to standard test conditions (25 degrees C cell temperature, 1000 W m-2 irradiance, AM1.5 spectrum); in column 4, a reference set of measurements taken on this module at our Sede Boqer test facility at a similar time of year [1].
One sees that the agreement between our results at Al Kaabneh and Sede Boqer, for the SX45 reference module, is sufficiently close to indicate that no serious systematic errors were made during the Al Kaabneh tests. 5.2 Control module ASE 50-AL/17 The significance of this module lies in the fact that it has cells of similar type and size to those of the ASE 300-DGF/17 modules that were under test; the smaller module having 36 cells in series and the latter, 216 cells, wired as 6 parallel strings of 36 cells. (cell dimensions: 10 cm x 10 cm) In principle, this module would have sufficed as a control module but in practice it is too recent an acquisition for us to have built up a robust data base of performance measurements, as we have done for the SX45 reference module (which contains polycrystalline Si cells). Table 3 presents the results of all seven I-V curve measurements taken at Al Kaabneh on the ASE 50-AL/17 control module, together with the results of a single set of measurements made the previous winter.
As already emphasized, the reference values, shown in Table 3, for the parameters of this module were measured in winter. At that time of year, owing to spectral differences in the light, one expects slightly higher efficiencies for crystalline silicon cells than in summer (when referred to standard temperature and illumination levels) [2,3]. Our measurements at Al Kaabneh on this second control module are therefore in accord with what we could have expected based on our previous measurements on this module.
6. IN SITU STUDY OF THE ASE 300-DGF/17 TEST MODULES 6.1 The uncleaned test modules Tables 4A - 4H show the corresponding results for the three measurements made on each of the ASE 300-DGF/17 test modules in the system design orientation. In order to perform the STC adjustments, we used voltage and current temperature coefficients derived from values we had determined for our control ASE 50-AL/17 module, mutatis mutandis. Namely, in the case of the smaller module, we measured the values: a = 1.6 mA K-1, b = - 61 mV K-1; hence, for the larger module, we employed the values: a = 9.6 mA K-1, b = - 61 mV K-1.
Two important points are clear from Tables 4A-4H. First; for each module, all three measurements yielded extremely similar results - in spite of the I-V curve tracer and thermocouples having been disconnected, and reconnected after approximately 15 minutes, between measurements, and in spite of the irradiance not having been at normal incidence. This gives us increased confidence in the accuracy of our measurements. Second; all eight modules are seen to have quite similar I-V curve parameters. This is to be expected for new modules manufactured to high levels of quality control. In the present case the standard deviation among the power ratings for the eight modules is seen to be smaller than ±1% of their mean value. In our experience, this represents an unusually high level of quality control for commercial modules. 6.2 The effect of cleaning the test modules As mentioned above, after the first three "as is" runs, modules "A" and "B" were cleaned. Each was then tested three times at the system design 25o tilt angle, and module "A" was subsequently tested four times at normal incidence. Tables 5A, 5B and 5AN display the respective results of these measurements.
Comparison of Tables 5A and 5AN reveal no significant difference between the STC-adjusted module parameters measured at normal incidence and at a 25o tilt angle to the horizontal. This is not really surprising since both sets of measurements were made a few minutes on either side of solar noon, and at this time of year this coincides tolerably closely to normal incidence on a 25o tilted surface. [To be precise, solar noon was at 11:45, at which time the zenith angle was close to 10o. This means that the angle of incidence was approximately 15o, the cosine of which is 0.97]. We should also comment that the STC value of Pmax = 270 W determined, from our normal incidence measurements on the cleaned module A, represents a gross-area module efficiency of 11.2%. This would place the ASE 300 among the highest efficiency modules we have studied under desert conditions.
Comparison of Tables 5A and 5B with the corresponding Tables 4A and 4B indicate that dirt on the modules was responsible for an approximately 5% lowering of system performance. We have no way of knowing when, if at all, the modules had been cleaned prior to these measurements; however, the ease of access to the modules suggests that periodic cleaning should present no problem.
7. OVERALL ARRAY PERFORMANCE Two measurements were made, downstairs, of "array 1" and three measurements of "array 2". We did not investigate which of these corresponds to the northern string of modules and which to the southern one. However, in view of the similar measured specifications of all modules, and considering the other uncertainties (i.e. extrapolated solar irradiance and module temperatures) this information is not vital. The main purpose of these final measurements was to verify that the array had been re-connected in a satisfactory manner and to provide some idea of the extent to which what was being generated on the roof was comparable to what was reaching the inverter/storage room. Assuming module temperatures of 56o C and a plane-of-array irradiance of 975 W m-2, "array 1" was found to have an STC-adjusted maximum power point of 1059 W and "array 2" was found to have a value of 1039 W. If we compare these with the sums of the STC-adjusted maximum power points of the northern array, as given in Tables 4A-4D (1028 W), and the southern array, as given in Tables 4E-4H (1038 W), we find, at worst, a 3% discrepancy. In view of the stated uncertainties we may confidently conclude that the DC power supplied to the inverters coincided closely with what was being generated by the array.
8. CONCLUSIONS AND RECOMMENDATIONS We have performed a self-consistent set of in-situ measurements which: (a) provide a detailed, high-precision characterization of all modules in the array; (b) indicate that all modules have rather similar characteristics to one another (with gross-area STC module efficiencies in excess of 11%); (c) indicate that the array modules have comparable performance parameters, mutatis mutandis, to an unused control module of similar construction; (d) provide some information of the effect of dust on the array; (e) provide a quantitative set of initial parameters for future follow-up measurements. On the day in question, we found the array to be functioning in a completely satisfactory manner in that: (a) no modules were defective; (b) all modules had similar characteristics to within ±1% of the mean; (c) the module performances figures were comparable to those of a control module of similar construction that we had taken along to accompany these tests; (d) the power arriving at the inverter was comparable to the amount being generated by the array.
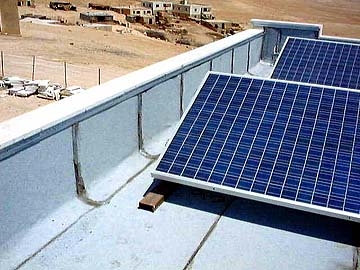
However, the storage batteries were observed to be fully charged at noon. This fact together with a number of other system observations, enumerated below, should be brought to the attention of the system designers/installers, in order to maximize the effiency at which the system may be expected to operate at all times of the year. 1. The school year runs from October through June. This means that the PV system is essentially unused during the months when it is capable of producing its highest output (approximately 30% of the annual total). In view of the fact that most of the villagers have no home electricity supply we would suggest that there may be useful ways for re-directing the summer surplus from the school. 2. The inverter system is currently of less than optimal design. The main (Trace Corp.) inverter produces a 110 V output which is not compatible with local consumer electrical products - which operate at 230V. A second, smaller, 220 V inverter, of 1 kWp rating, is connected to a subset of the storage batteries, but it is not compatible with the array voltage and will probably lead to uneven battery aging. This setup certainly reduces the overall system efficiency in a significant manner. 3. The most effective solution would be to replace the present inverters with a 230 V model, appropriately matched to the array. Serious consideration should also be given to the desirability and practicality of eliminating the need for AC power by using DC appliances. 4. We should also report on two slight installation oversights, both of which are easy to rectify. First, the west side of the PV array is located too close to the roof parapet (See Fig.5). The latter will cast an afternoon shadow, particularly in winter, which will result in a serious decrease in short-circuit current for the array. The entire array should be shifted eastward by approximately 1-2 meters. Table 6 lists some relevant dimensions and angles will enable the precise shift required to be calculated. 5. Second, the wiring and module interconnects on the roof were found to be of an improvised nature, no doubt to facilitate check-out activities such as our own. Proper waterproof interconnects should, of course, be installed before the rainy season and the wiring should be protected from chance encounters with humans. 6. Finally, it would be desirable to perform annual follow-up system checks. 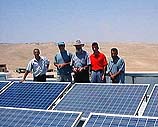
9. REFERENCES [1] D. Berman and D. Faiman, Solar Energy Materials and Solar Cells, vol.45 (1997) 401-41. [2] D.L. King and P.E. Eckert, 25th IEEE PV Specialists Conference, May 13-17, 1996, Washington DC, (IEEE, Piscataway, NJ, USA) pp 1385-1388. [3] D. Berman, D. Faiman and B. Farhi, Solar Energy Materials and Solar Cells, vol.58 (1999) 253-264.
|